
Correlation Analysis
Methods of correlation and regression can be used in order to analyze the extent and the nature of relationships between different variables. Correlation analysis is used to understand the nature of relationships between two individual variables. For example, if we aim to study the impact of foreign direct investment (FDI) on the level of economic growth in Vietnam, then two variables can be specified as the amounts of FDI and GDP for the same period.
Correlation coefficient ‘r’ is calculated through the following formula:
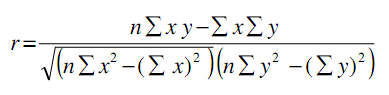
Where, x and y are values of variables, and n is size of the sample.
The value of correlation coefficient can be interpreted in the following manner:
If ‘r’ is equal to 1, then there is perfect positive correlation between two values;
If ‘r’ is equal to -1, then there is perfect negative correlation between two values;
If ‘r’ is equal to zero, then there is no correlation between the two values.
In practical terms, the closer the value of ‘r’ to 1, the higher positive impact of FDI on GDP growth in Vietnam. Similarly, if the value of ‘r’ is less than 0, the closer it is to – 1, the greater the negative impact of FDI on GDP growth in Vietnam. If ‘r’ is equal to zero, then FDI is perceived to have no impact on GDP change in Vietnama within the given sample.
The most popular forms of correlation analysis used in business studies include Pearson product-moment correlation, Spearman Rank correlation and Autocorrelation.
The Pearson product-moment correlation is calculated by taking the ratio of the sample of the two variables to the product of the two standard deviations and illustrates the strength of linear relationships. In Pearson product-moment correlation the correlation coefficient is not robust due to the fact that strong linear relationships between the variables are not recognized. The correlation coefficient is sensitive to outlying points therefore the correlation coefficient is not resistant.
Spearman Rank correlation requires the data to be sorted and the value to be assigned a specific rank with 1 to be assigned as the lowest value. Moreover, in case of data value appearing more than once, equal values will be specified their average rank.
Autocorrelation (serial correlation) implies the correlation among the values of the same variables but at various times. Autocorrelation coefficient is calculated by changing lagged data with the formula for the Pearson product-moment correlation coefficient. Also, because a series of unshifted data will express perfect correlation, the function begins with the coefficient of 1.
Correlation coefficient ‘r’ illustrated above is just a mathematical formula and you don’t have to calculate correlation coefficient manually. For a bachelor’s degree dissertation most supervisors accept correlation tests that have been run on a simple Excel spreadsheet. For master’s or PhD level studies, on the other hand, you will have to use more advanced statistical software such as SPSS or NCSS for your correlation analysis.
Correlation analysis as a research method offers a range of advantages. This method allows data analysis from many subjects simultaneously. Moreover, correlation analysis can study a wide range of variables and their interrelations. On the negative side, findings of correlation does not indicate causations i.e. cause and effect relationships.
My e-book, The Ultimate Guide to Writing a Dissertation in Business Studies: a step by step assistance offers practical assistance to complete a dissertation with minimum or no stress. The e-book covers all stages of writing a dissertation starting from the selection to the research area to submitting the completed version of the work within the deadline. John Dudovskiy